Being more of an analytical thinker, I have found myself becoming more fully indulged in math than in any other subject. Ever since learning how to do long division back in the fourth grade, I've found myself creating and solving long division problems whenever I'm bored or waiting in a long line. In the last five years, I've found myself getting sucked into the whole Sudoku phenomenon, and feel all the more intelligent for it. I'm not trying to knock other subjects (as I'm also keen on writing poetry), I'm simply saying that math has always held a special place in me. And, this special connection is one that I consistently work towards passing on to my students.
At my last school, I used Microsoft Excel to teach 2nd, 3rd and 4th grade students how to graph the typing test scores that they had been recording for a total of 10 weeks. The students loved seeing how their scores had changed over time, and they especially loved learning how to graph their very own scores on Microsoft Excel.
That same year, I also led a Professional Development session for teachers on the ways in which one could use Microsoft Excel. Having spent a previous work life dabbling in data analysis, I've become very aware of the many functionalities, and as a teacher I realize that there are only a handful of ways in which Microsoft Excel proves to be more useful than any other tool out there.
Ways in which Microsoft Excel is useful for teachers
- Creating rubrics
- Maintaining grades
- Organizing classes
Below is a list of some of the many ways in which Microsoft Excel can be used in teaching students.
- Creating data tables from surveys. (3.MD.3)
- Graphing data. (3.MD.3)
- Creating pictographs. (2.MD.10)
- Finding area. (4.MD.3)
- Finding perimeter. (4.MD.3)
- Evaluating and generating patterns. (4.OA.5)
- Interpreting and creating line plots. (4.MD.4)
This week, I began a two-lesson project on creating graphs in my fourth grade classes (after Thanksgiving break, I will begin the same lesson for my third grade classes). Since the vast majority of our fourth graders are unfortunately addicted to television, I decided to start with a survey that they could relate to. To begin the lesson, we started with an impromptu survey of their favorite TV shows. Once we had united to compile a list of four TV shows, we polled the class on the shows that they watched. I explained to the students that unlike the voting that transpires in Presidential elections, they could actually vote on more than one TV show, as this was a data project that was based on the shows they watched, not their favorite show.
My current fourth grade classes are very small, with only 8 to 13 students. So, needless to say, our data tables were not very large.
Phase Two
In any Microsoft Excel lesson, it is important to review the very basic vocabulary: worksheet, cell, column, and row.
worksheet = the large area in which all of the cells are located
cell = a rectangular on a worksheet; cell name is based on where the column and row
intersect, e.g.: 'D4'.
column = goes up and down on the worksheet; vertical line of cells that is represented by a
letter
row = goes from left to right on the worksheet; horizontal line of cells that is represented by
a number
Phase Three
After reviewing the vocabulary we played a brief, speed game of "Name that cell". In the game, I would click on a cell and the students would have to yell out the correct cell name. The game would continue until everyone said the correct cell name 5 times in a row. By this point, I knew that they knew how to identify a cell name.
Phase Four
Next, I showed and explained to the students that any information that you typed into a cell would also appear in the formula box at the top of the menu bar. It's important to also highlight the fact that pressing 'Enter' moves you down to the next cell, as using the area keys while actively altering a cell produces no results.
I modeled for students how they would type one TV show name into each cell and press 'Enter' after each. Once the students had completed this step, we were able to move onto the fun step of expanding columns.
Phase Five
This is the part that confuses most adults who are new to Microsoft Excel. When information in a cell exceeds the size of the cell, it is easy to tell where the information starts, but hard to tell where it ends. Thus, it's important to note that the cell the information is contained in is based on the cell where the information is first seen. Below are some screenshots to show examples of this concept.

In the image above, it looks as though 'Hannah Montana' is contained in cells C3 and D3. It also looks as though 'Spongebob Squarepants' is contained in cells C5 and D5.
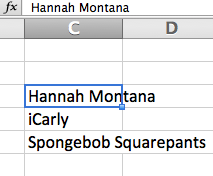
The image above shows the reality of 'Hannah Montana' being maintained in cell C3 as is depicted by the fx (formula) bar. The same applies for 'Spongebob Squarepants'.
The ability to expand rows and columns was definitely the jaw-dropping moment of this lesson. To aid in clarifying the exact cell location for each piece of data, I taught the students how to expand the effected columns.
Much like adults, students are also fooled by what they see in Microsoft Excel. Thus, teaching individuals how to expand columns is a necessary step in any Microsoft Excel lesson.
Below is an image that depicts this process.

In the above image, the mouse appears as a line with an arrow on either side. This tool only appears when you move the mouse in between two numbers or two letters. When the tool appears, simply click and drag out to expand the column.
Once the column with the TV shows is expanded, it is time to enter the votes for each TV show. In this step, it is important to explain that the numbers appear are right-aligned simply because they are numbers. Had they been words instead, they would be left-aligned.

The image above shows the words as being left-aligned, while the numbers are right-aligned.
Phase Eight
The next step is all about selecting the specific cells to add a border to. This can be done in one of two ways.
- Click on the first cell of the group. Click and drag so that only the appropriate cells are highlighted.
2. Use the arrow keys to navigate to the first cell of the group. Hold the 'shift' key down to
highlight the appropriate cells.

The above image shows a highlighted group of cells.
Once the proper cells are selected, a border can be applied. To apply a border, you must select the border option in the main menu. Then, you must choose 'all borders'.


The above steps merely cover the first of two lessons on graphing in Microsoft Excel. The second lesson will deal with labeling the data as well as creating and editing the graph.
The belief is that students learn by doing. Thus, if students are given the opportunity to create and interpret their own graphs, then they'll likely be able to replicate the same process on a standardized test. This is a skill that is not just applicable to testing environments, it is also applicable to high school and college math courses as well as many different career functions.
After Thanksgiving Break, I'll be sharing a blog on my students' success with creating graphs on Microsoft Excel.
Hope you enjoyed.
No comments:
Post a Comment